During the Falkland Islands Communications Week, it was mentioned that Sure needed to “look at broadband contention going forward” [or something close to that]. So what? you may say. The reason it’s important is that contention has a major impact on the Quality of Experience of using the Internet. It’s certainly nearly equal to the issue of increasing Satellite Capacity. Contention Ratios, the way contention is calculated, are undoubtedly less visible and could be considered a bit ‘techie’, but they are a key – if not the key – engineering parameter in planning what Satellite Capacity is needed going forward. It’s certainly important for FIG, as it what determines what broadband KPI levels should set going forward.

Too many passengers for the carriage?
Although this post is quite technical, it really would be worthwhile to plough through it as it may give some insight to the KPIs that were created as part of Sure’s exclusive licence. The choice of what Contention Ratios are used going forward will have a profound effect on Quality of Experience and it’s not just a boring technical number. Contention Ratios have a great impact on the affordability versus performance trade-off when considering the purchase of additional Satellite Capacity. Affordability was brought up time and time again during Communications Week.
So, what are Contention Ratios?
Using Wikipedia’s definition a Contention Ratio:
Contention Ratio is the ratio of the potential maximum demand to the actual bandwidth. The higher the contention ratio, the greater the number of users that may be trying to use the actual bandwidth at any one time and, therefore, the lower the effective bandwidth offered, especially at peak times.
The more users using the satellite bandwidth at the same time, the greater the contention and congestion and the slower the broadband service becomes.
The Contention Ratio is an objective number calculated by dividing the total number of users by – in the case of the Falkland Islands – Satellite Capacity as that is the bottleneck. It is a key metric in the planning and design of any broadband network.
Importantly, the LOWER the Contention Ratio; the BETTER the Quality of Experience. The HIGHER the Contention Ratio; the WORSE the Quality of Experience. The more users concurrently sharing a fixed capacity such as the Falkland Islands satellite link, the more the potential for congestion at times of peak usage.
Standard Contention Ratios ten years ago used to be around 50:1 for home broadband, and 20:1 for business broadband – but these figures are no longer appropriate with the dominance of video streaming services.
In this post, I’d like to look at what the Contention Ratios are in the Falkland Islands’ broadband service and the impact of increasing the agreed KPIs – monthly quota, broadband package access speeds (or Maximum Download Speeds) and Satellite Capacity – are on Contention Ratios.
A simple introduction of how Contention Ratios are impacted by increases in broadband Maximum Download Speeds and Monthly Quotas.
For all my calculations, I assume that customers’ usage habits of using the Internet do not change when Monthly Quotas and/or access rates are increased – they just do more of the same things. This allows calculations to be done comparing Contention Ratios in 2017, 2018 and 2019 using 2016 as the base line.
Increasing Maximum Download Speeds:
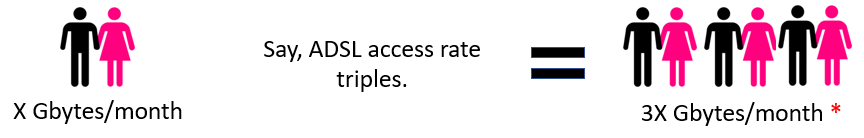
Assuming a customer downloads ‘X’ Gbytes/month. Increasing their Maximum Download Speed by 3x is the equivalent of having 3 customers as they will consume 3x the amount of data. I hope this is clear as it took me some time to get my head around this!
Increasing monthly usage quota:
Assuming a customer downloads ‘X’ Gbytes/month. Similarly, increasing their Monthly Quota by 3x usage quota by 3 is the equivalent of having 3 customers as they will consume 3x the amount of data in a month.

Increasing Maximum Download Speeds AND Monthly Quotas:
If a customer gets an increase of 3x in Maximum Download Speeds AND 3x of monthly quota, this is equivalent of having 9 customers. That’s a big increase that will have a big impact on Contention Ratios.

The three broadband KPIs agreed with FIG as an element of the exclusive licence.
1. Satellite Capacity increases:
2. Maximum Download Speeds.
An increase of 171% increase in Monthly Quotas is equivalent to increasing the number of customers by 171%.
3. Monthly Quotas.
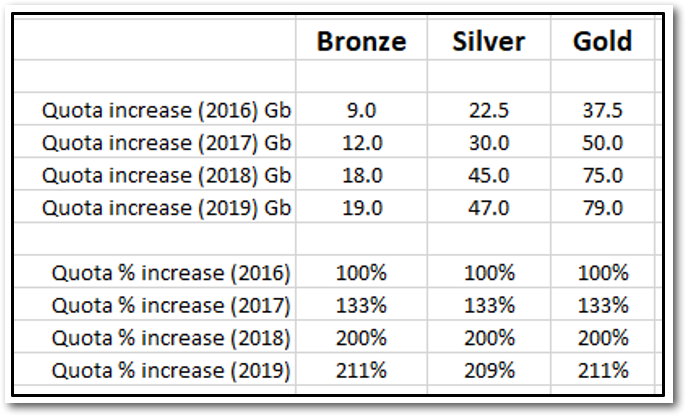
An increase of 211% increase in Monthly Quotas is equivalent to increasing number of customers by 211%.
Remember that increasing Monthly Quotas and Maximum Download Speeds increases demand (the number of packets hitting the satellite) is BAD for Quality of Experience. While increasing Satellite Capacity to be able to satisfy demand is GOOD.
If demand increases then this chould be balanced by an increase in Satellite Capacity to keep the network balanced and the Contention Ratio at similar levels.
Phew! I think we are there by way of explanation so let’s look at some interesting Contention Ratio scenarios that will inform us about how to judge possible future Satellite Capacity increases.
Over the last four years Maximum Download Speeds and Monthly Quotas have been increased at the same time as increasing satellite bandwidth but what would happen if they had not? I wanted an answer to this so I did some simple calculations for the following scenarios.
Caveat: I do not know the exact mix of Sure’s customers between Starter, Lite, Bronze, Silver, Gold and Platinum broadband packages, but I have made assumptions based on some publically quoted numbers. Sure, during Communications Week, said they had 1,800 [consumer and business] customers in 2019. It is estimated that there are currently over 1,900 households in Stanley (The 2016 census quotes 1,361 households with 1,189 occupied. 93% having Internet access).
Contention Ratios are calculated by the simple formula Maximum Download Speeds multiplied by Number of customers divided by Satellite Capacity. The calculation took into account the differant numbers of each broadband package so the spreadsheet got quite complicated!
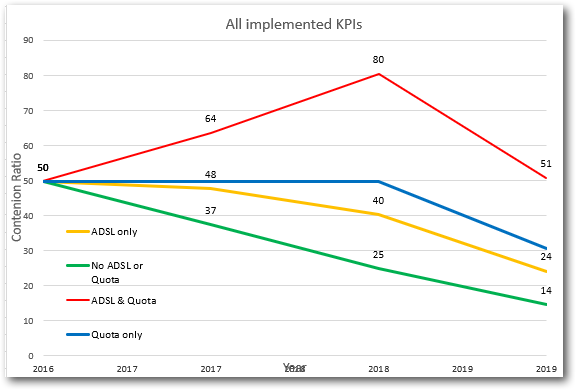
Scenario #1: Increasing monthly quota and Satellite Capacity ONLY.
This scenario comes first as it quite surprised me. It is a straight line with a Contention Ratio of 50 for all years.
The engineering calculations undertaken had an appropriate planning objective of maintaining the same Contention Ratio year-on-year and thus maintain the same broadband Quality of Experience. I don’t have accurate enough data to say that a Contention Ratio of 50 was actually used, but I would doubt it is far off as this was accepted number for a consumer service a few years ago. A Contention Ratio of 20 is much more appropriate for businesses.
Most importantly, this indicates to me that the engineering calculations that were undertook to calculate what the increases in Satellite Capacity through 2016 to 2019 needed to be, were only based on increasing Monthly Quotas. They do not seem to have taken into account increases to Maximum Download Speeds through 2016 to 2019 unless I have things totally wrong? Oh, which came first and drove the engineering calculations – the Monthly Quota increases or the satellite capacities?
 Contention Ratios achieved by increasing Monthly Quotas and Satellite Capacity only.
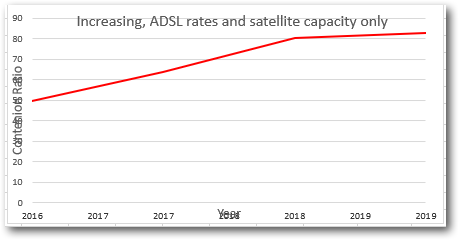
Scenario #2: Increasing Maximum Download Speeds and Satellite Capacity ONLY.
It is interesting to see that if the Monthly Quotas had not been increased but only the Maximum Download Speeds and Satellite Capacity increased, there would be a reduction of Contention Ratio from 50 to 40 over the period 2016 to 2019. Thus there would have been a marginal increase in Quality of Experience most noticeable at times when there is no congestion.
It was stated during the Communications Week that the Falkland islands had a a 5Mbit/s broadband service but we do have to be careful about that claim. Yes, the Maximum Download Speeds are set at that level for the Gold package but there is no way that that download speed can be experienced at times of peak congestion as download speeds are slowed down at that those times to make sure that the service continues to work for all customers. Take a look at The enigma of the monthly Internet usage quota post for a more detailed overview of this.
In practice, during these times of congestion, download speeds could drop to 100s of kbit/s so the Maximum Download Speeds are pretty irrelevant at those times of day.
 Contention Ratios achieved by increasing Maximum Download Speeds and Satellite Capacity only.
Scenario #3: Increasing Maximum Download Speeds, the Monthly Quota and Satellite Capacity.
This was the policy adopted for introducing the KPIs over the period 2016 through 2019. As can been seen, this results in a significant increase in Contention Ratio increasing from 50 to 83. If these calculations are correct, it would certainly mean that the broadband Quality of Experience at times of maximum congestion would have deteriorated rather than improved over the period. In a capacity planning scenario without bandwidth constraint, Contention Ratios should have been maintained over the period to keep the same Quality of Experience.
 Contention Ratios achieved by increasing Maximum Download
Speeds, Monthly Quotas and Satellite Capacity.
Scenario #4: Increasing Satellite Capacity only.
I thought the most interesting theoretical scenario to look at was to keep the Maximum Download Speeds and the Monthly Quotas the same as they were in 2016 while only increasing the Satellite Capacity. As you can see below this results in a big improvement in Contention Ratios reducing from 50 to 23 in 2019.
This is a quarter of the Contention Ratio resulting from implementing all three KPIs over the period of 2016 to 2019. I would expect that would have had a big positive change to the broadband Quality of Experience. However a contention Ration is probably too low for consumer services but perfect for businesses!
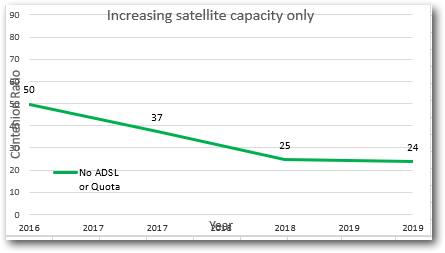 Increasing Satellite Capacity only
Broadband Quality Ratios
By dividing Satellite Capacity by the Contention Ratio a Quality Ratio can be calculated. This is my own invention I need to say, but is does show the stark differences between the described scenarios clearly.
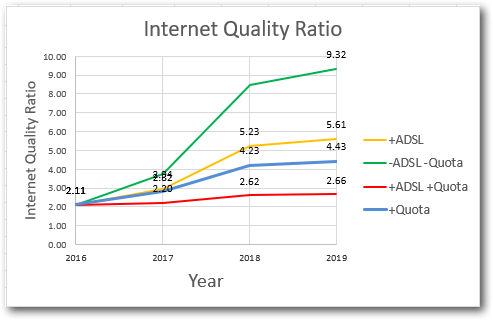
Broadband Quality Ratios
These scenario calulations raised a question – What Satellite Capacity would be required to maintain the same Contention Ratio in 2019 as in 2016?
 Maintaining the same Contention Ratio in 2019 as in 2016
It turns out that the Satellite Capacity would have needed to be 360Mbit/s so the 2019 increase is less than what is needed . Of course, the option of reducing the number of users to achieve the same result is not an option at all!
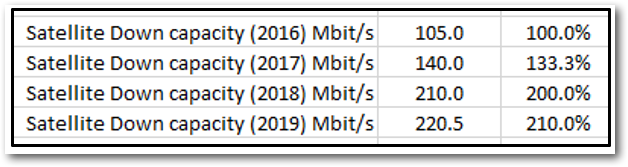
To a degree, my Contention Ratio calculations can be confirmed ‘by eye’ by just looking at the graph of Falkland Islands Satellite Capacity increases from 2004 to 2018. 360Mbit/s can be seen to be what capacity is required in 2019 to maintain Contention Ratios; the red line better follows history of capacity increases and the blue line shows actual capacity. Please be careful about using this graph as there are inaccuracies caused by plotting by years not months.
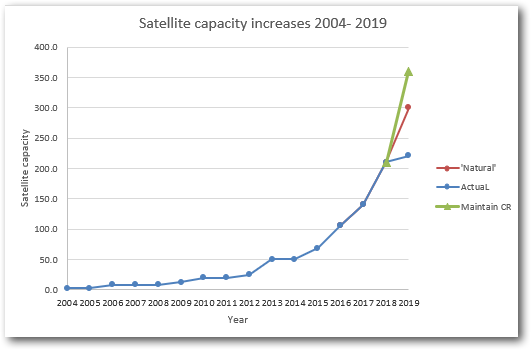 Falkland Islands satellite capacity increases – 2004 to 2018
These Contention Ratio Calculations are conservative.
I believe the Contention Ratios calculations undertook are quite conservative as they do not include IP traffic generated by the following generators of demand and others:
-
- 4G data traffic: [each mobile could create potentially greater traffic rates than an ADSL line]
- Visitor traffic
- Mount Pleasant Airport military traffic
- Wi-Fi hotspot traffic
- FIG intranet traffic
- Plus other
Contention Ratio thoughts
I hope you have managed to stick with me on a rather long and convoluted techical discussion of Contention Ratios, but I hope I have conveyed why it is so important to include this metric when considering the ‘affordability’ of future Satellite Capacity upgrades. It’s simple for FIG and Sure to keep on increasing time access to the Internet by increasing quotas, but it would also be so tempting to reduce the cost impact of increasing Satellite Capacity by letting Contention Ratios creep up.
I would not expect that broadband Maximum Download Speeds to increase much more as there is no point as these rates are never achieved anyway at times of congestion. There is a similar situation in the UK that OFCOM is trying to address as Minimum Download Speeds are the critical metric. Of course, if there were more local Internet services available then Maximum Download Speeds would be more relevant. Local businesses would see Maximum Download Speeds as important as these are important for island-based VPNs for example.
The calculations I’ve undertaken raises an interesting question though.
Would broadband customers prefer to spend MORE TIME in a month web browsing using a slower and frustrating service?

Or…
Would customers prefer a zippier and potentially less frustrating service for LESS TIME in a month browsing? The irony would be that users could do all they wanted to do more efficiently and faster spending LESS TIME on the internet achieving the same objectives and leaving MORE TIME for other uses?
It is a trade-off that every ISP and regulator has to make while planning its capacity upgrades, but it’s particularly important in the Falkland Islands relying as it does on a slow 500mS latency geo-stationary satellite. It’s certainly something to add to the list of things that should be discussed publically rather than behind closed doors.
Note: If my calculations are off the mark then I’d love to know!
OK, OK I’m listening! – Here is a approximate forecast graph of Satellite Capacity based on historical increases and ignoring 2019 increase.
Rough Satellite Capacity through to 2024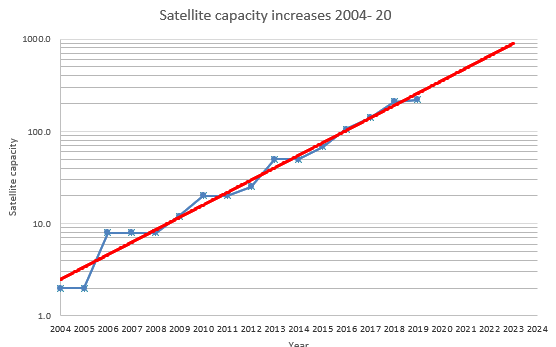
Of course, there would be no real increase in Quality of Experince unless there was the addition of MEO satellite capacity as discussed in my post – Falkland Islands’ satellite – spoilt for choice! Part 2, O3B mPOWER when latency would be significantly reduced. Or, of course, an opportunity was taken to reduce Contention Ratios as discussed in this post.
It’s really interesting to see that the Satellite Capacity required in 2024 would be at least 900Mbit/s and this is just about the size of an mPOWER spot beam. A coincidence or what?
Chris Gare, March 2019 Copyright: OpenFalklands.com

You do not mention it, but have you provided for the amount of overage in earlier years to inform the trend?There has I think been some admission by sure regarding the revenue % from overage to base it on. I would expect the inclusion or exclusion of overage to have a marked impact on your results
Hi Hamish. No I have not included any estimates of the amount of overage, as I have no details of what those might be. If I did include it, then it would increase the Contention Ratios, but it would not affect the year-on-year realationships I think.